
This article is to explain some differences in key Power Quality Monitoring Equipment and the importance of their specific roles used to collect data. I would like to start off by saying many companies state that they perform “power quality” studies and while this may or may not be true, it all is defined on how a power quality study is perceived. It is APQ’s standard to provide an entire facility outlook, not only going over current and voltage but also going over all aspects of power. This includes harmonics, inter-harmonics, power factor, inrush events and most importantly event sine wave capture, along with much more. Once you have a basic understanding of what a true power quality study is, then you can start to utilize the proper power quality monitoring equipment.
The most important piece of PQ Monitoring Equipment in the tool bag is the PQA or power quality analyzer. The last word “Analyzer” is very important to remember. There are many different types of power quality data collecting devices, the most common are either Loggers or Analyzers. The key differences are typically the logger does not capture sine waves. The logger with typically only capture RMS data, normally just voltage and current. There are some loggers out there that will capture harmonics, power factor and will sometimes give event notifications such as over/under voltage. However, it is important to note that the speed in which the logger samples is “slow” compared to what is needed to perform a true power quality study. The typical sample rate will be around .5 captures per cycle. The logger is still a great piece of equipment and has it’s uses, typically for load profiles or checking RMS voltage levels. You will typically see your more experienced electricians utilize a logger. Some examples would be the Fluke 1732-1748 series power quality loggers.
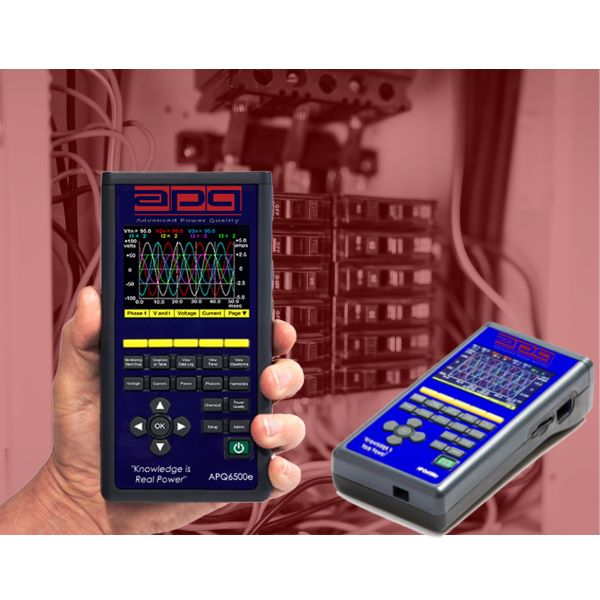
The piece of equipment every good power quality engineer needs in their tool bag is a good PQA. The analyzer will not only do everything the logger will do, but will also capture event sine waves. This is the fundamental of reviewing data to see what is truly going on inside a facility. In addition, the analyzer’s capture rate will be much higher than the logger. Your typical analyzer will capture at 256 samples per cycle or higher. APQ utilizes analyzers that typically capture at 512 samples per cycle. Some examples of good power quality analyzers would be the CHK Miro PQ45, the HIOKI PQ3198 or the Fluke 1750.
So now you have yourself a good power quality analyzer, now what? Operating and setting up this piece of equipment might sometimes feel like rocket science. We recommend taking several introductions to PQ (power quality) classes to fully understand PQ issues and what you should setup the analyzer to look for/capture when doing a study.
In addition, once you collect the data, reading the data might look like another language. Interpreting the data is what separates a true power quality engineer from the rest. The sine wave captures will tell you a story of what is going on inside the facility and how the equipment is being affected. Each piece of equipment turning on/off, every type of electrical issue, each electric utility event, they will all leave unique fingerprints on the sine wave. It is up to the power quality engineer to read these fingers prints and know what is going on. My recommendation for the first step in learning what the basic “fingerprints” are is “Dranetz Book of Sine Wave Signatures”. This book will give you a basic understanding of the most common sine wave captures, their symptoms and remedies for any issues associated.
For more information contact APQ at 813-723-2776.
Check out our strategic partner company ALPHA POWER SYSTEMS